SaaS Growth Benchmarks: Company Growth Rates and Metrics
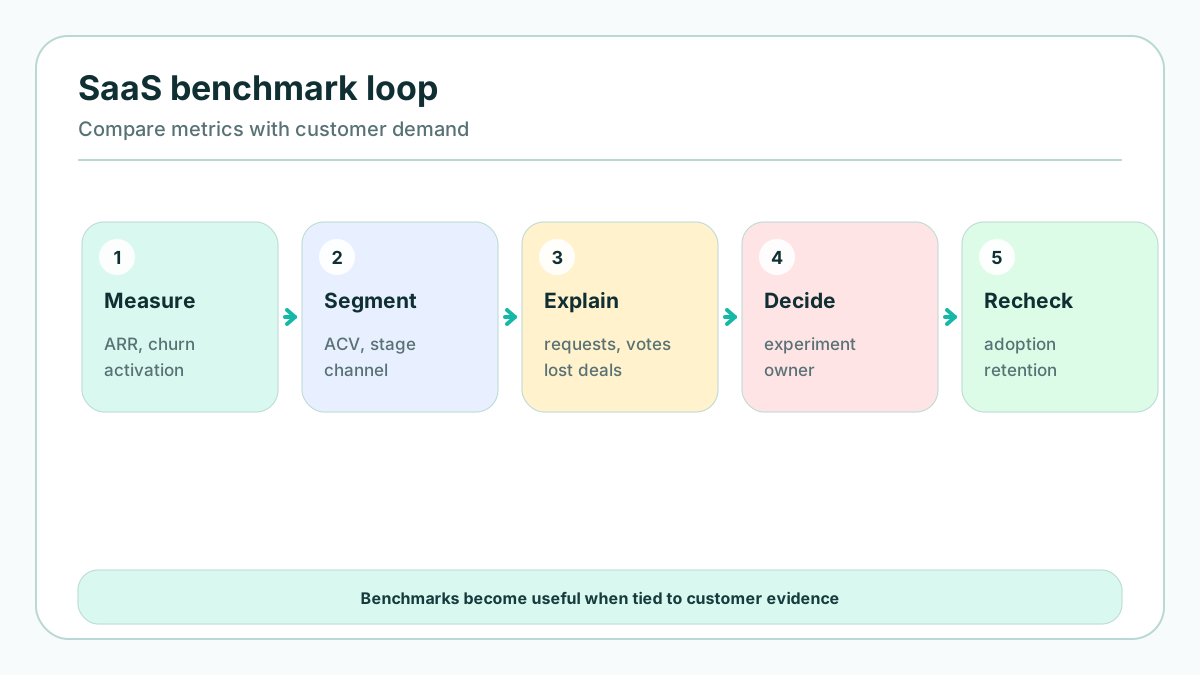
SaaS growth benchmarks can be helpful, but only when you use them as a calibration tool rather than a scoreboard. A benchmark can tell you whether your ARR growth, retention, CAC payback, or activation rate looks unusual compared with similar companies. It cannot tell you why the number moved, which customer segment matters most, or which roadmap decision will fix the constraint.
That distinction matters for small SaaS teams. A bootstrapped workflow tool, a product-led collaboration app, and an enterprise security platform can all appear in the same SaaS report while operating under completely different rules. One sells monthly subscriptions with a fast trial. Another needs procurement, implementation, and executive sponsorship. Their growth rates, contract values, churn patterns, and payback expectations should not be interpreted the same way.
This guide turns SaaS growth benchmarks into an operating system. It explains which metrics to compare, how expectations change by stage, which public reference points are worth knowing, and how to combine numbers with customer evidence before changing your plan. The goal is not to look exactly like a public SaaS company. The goal is to build growth that is explainable, repeatable, and tied to problems customers still want solved.
If you need a lightweight way to capture the customer evidence behind your benchmarks, start a FeaturAsk board with a 30-day free trial, no credit card required, and a simple $29.95/year plan when you are ready.
Use the right benchmark set before judging performance
The fastest way to misuse SaaS benchmarks is to compare your company with the wrong peer group. Before reacting to a median or top-quartile number, segment the comparison by annual recurring revenue, funding model, average contract value, buyer type, product-led versus sales-led motion, category maturity, and whether the company sells mostly to SMB, mid-market, or enterprise customers.
A self-serve product should care deeply about visitor-to-signup conversion, activation, product-qualified accounts, free-to-paid conversion, support tickets per account, and expansion signals inside active teams. An enterprise product should pay more attention to pipeline quality, sales cycle length, proof-of-concept completion, implementation time, renewal risk, stakeholder coverage, and expansion after the first department succeeds. Both models can be healthy, but the healthy shape looks different.
Benchmarks also change with company size. Very small SaaS companies can double revenue from a tiny base and still be fragile. Larger companies may grow at a lower percentage rate while adding much more absolute ARR. A 100% growth rate at $250k ARR and a 40% growth rate at $10m ARR are not comparable management problems. Always ask: what stage does this benchmark describe, and what decision will it actually influence?
The core SaaS growth benchmark stack
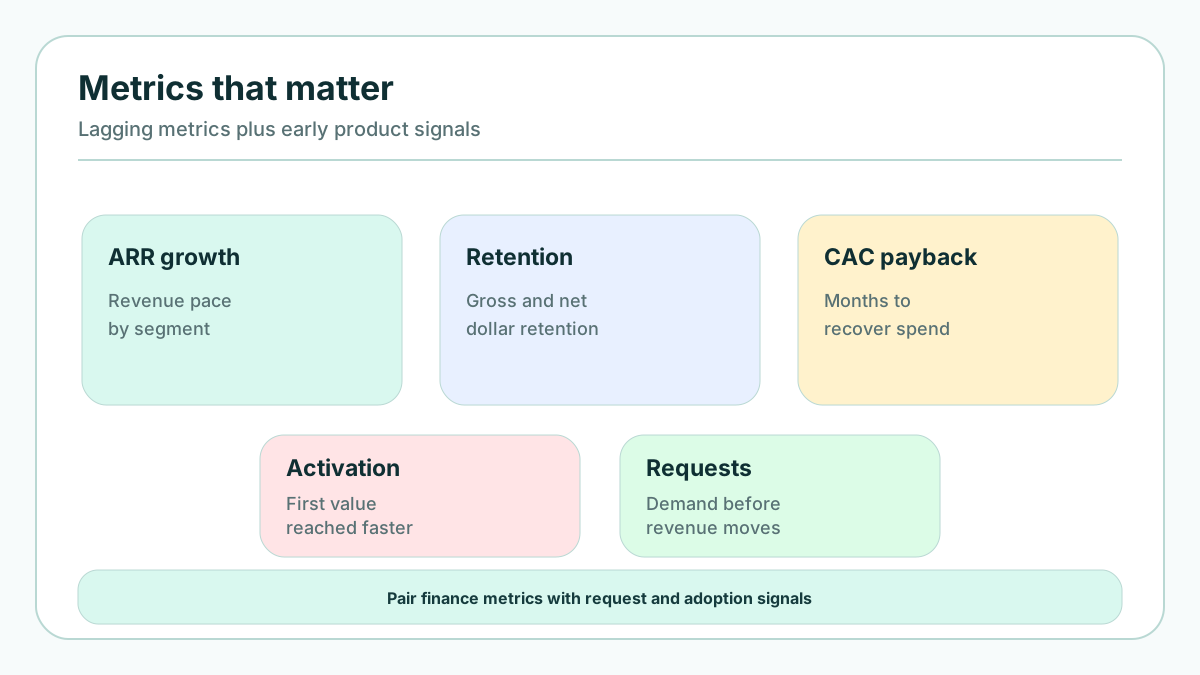
A practical benchmark stack has four layers: revenue growth, retention quality, acquisition efficiency, and product adoption. Looking at only one layer creates distorted conclusions. Fast ARR growth can hide churn. Strong retention can hide weak acquisition. Efficient acquisition can hide poor activation if the team counts signups instead of successful users.
Revenue growth includes ARR, MRR, new sales, expansion, contraction, reactivation, and churn. Retention quality includes logo retention, gross revenue retention, net revenue retention, cohort expansion, and renewal predictability. Acquisition efficiency includes CAC, CAC payback, sales efficiency, pipeline conversion, and LTV-to-CAC. Product adoption includes activation rate, time to first value, feature adoption, usage frequency, seat expansion, and qualitative satisfaction.
The most useful benchmark review connects all four layers. For example, if ARR growth is below target but activation is improving and churn is falling, the company may have a distribution problem. If ARR growth is strong but activation is weak and discounts are rising, the company may be buying short-term revenue with future churn risk. The benchmark should start a diagnosis, not end the conversation.
ARR growth: read the source, not just the headline
ARR growth is the benchmark most founders, boards, and investors watch first. It is also one of the easiest to misread. The headline percentage should always be split into new ARR, expansion ARR, contraction, churn, and reactivation. A company growing through retained-account expansion has a different engine from one growing through expensive new sales that churn after the first renewal.
Public and private benchmark reports show the same pattern: growth rates usually decline as revenue scale increases. SaaS Capital's private SaaS research has historically shown very high top-percentile growth among companies below $1m ARR, with lower but still strong growth expectations as companies pass larger ARR bands. OpenView's product benchmark work similarly emphasizes that growth expectations must be interpreted by motion and scale, not as one universal SaaS average.
For operating purposes, compare ARR growth against cohort health. Are newer customers activating faster than older customers? Do they reach the aha moment with less human help? Are expansion dollars coming from real adoption or from packaging pressure? Does churn concentrate in one segment, plan, or acquisition channel? These questions reveal whether growth is getting easier or merely more expensive.
A simple monthly ARR growth review should include five rows: beginning ARR, new ARR, expansion ARR, contraction and churn, and ending ARR. Add one written explanation for the largest change. If the explanation is a guess, mark it as a hypothesis and attach customer evidence before funding a major initiative.
Retention benchmarks: gross, net, logo, and cohort behavior
Retention is where SaaS growth quality becomes visible. Gross revenue retention tells you how much recurring revenue remains before expansion. Net revenue retention adds expansion back in. Logo retention shows how many customers stay, regardless of revenue size. Cohort retention shows whether specific customer groups behave differently over time.
Many teams over-focus on net revenue retention because a number above 100% feels reassuring. It can be reassuring, but only if gross retention is also strong. A company can show good net retention by expanding a few large accounts while quietly losing too many smaller customers. That might be acceptable for an enterprise strategy, but it is dangerous for a broad SMB product that depends on predictable volume.
Use retention benchmarks to ask more specific questions. Which segment renews best? Which acquisition source produces the highest churn? Which onboarding step predicts renewal? Which features correlate with expansion? Which promised use cases fail after purchase? A retention benchmark is most valuable when it leads to a sharper customer segment and a clearer product habit.
For a practical example, connect retention analysis with user feedback analysis. Churn data might tell you that early-stage agencies leave at a high rate. Feedback might reveal that they wanted white-label reporting, faster setup, or a different pricing unit. The number points to the problem area; customer language explains the work.
CAC payback and sales efficiency benchmarks
CAC payback measures how long it takes to recover customer acquisition costs from gross profit. It is one of the clearest benchmarks for whether growth is efficient. A short payback period gives a company more freedom to reinvest. A long payback period can be acceptable for enterprise contracts with strong retention and expansion, but it creates risk if churn is high or implementation costs are underestimated.
When benchmarking CAC payback, include the full cost of acquisition. That means sales salaries, marketing spend, commissions, tools, agencies, paid media, content production, and the portion of founder or customer-success time used to close and activate customers. Small SaaS teams often make acquisition look better than it is by ignoring founder labor or heavy onboarding support.
Sales efficiency adds another view. It asks how much new recurring revenue is generated for each dollar spent on sales and marketing. If sales efficiency is weakening, do not immediately hire more reps or increase ad spend. First inspect conversion by stage: qualified visitor to trial, trial to activation, activation to paid, demo to proposal, proposal to close, and close to successful onboarding.
The customer evidence layer is critical here. Slow payback might be caused by weak targeting, confusing positioning, an onboarding gap, missing integrations, or sales promises that the product does not yet fulfill. Each cause requires a different response. Benchmarking alone cannot choose between them.
Activation, product adoption, and time to value
Activation is the bridge between acquisition and retention. A company can generate plenty of trials or demos, but if users never experience the product's core value, growth will remain expensive. For product-led SaaS, activation is often the most important early benchmark. For sales-led SaaS, it still matters because implementation success predicts renewal and expansion.
Define activation around a real customer outcome, not an internal vanity event. “Created an account” is rarely activation. “Invited the team, imported data, published a roadmap, and received the first user vote” is a stronger activation definition for a feedback or roadmap product. The right activation event should correlate with long-term retention.
Time to value deserves its own benchmark. How long does it take a new account to experience the first meaningful result? If strong customers reach value in one day and weak customers take three weeks, the team should study what separates those journeys. Better templates, clearer empty states, improved onboarding emails, or a guided setup checklist can improve growth more than another top-of-funnel campaign.
Adoption depth also matters. Track how many active accounts use the features that predict retention, how many users participate inside each account, and whether usage expands after the first month. A SaaS company with modest signup volume but improving activation and adoption may be building a stronger engine than one with flashy traffic and weak usage.
How to run a monthly benchmark review
A good benchmark review should be short enough to repeat and specific enough to change behavior. Use a table with four columns: metric, benchmark or target, current explanation, and next action. The explanation column is the most important. A red metric should not become a vague instruction to “improve retention.” It should name the segment, behavior, or product moment that likely explains the gap.
For each metric, write one of three labels: healthy, watch, or investigate. Healthy means the number is acceptable and the supporting evidence is stable. Watch means the number changed but the team has a plausible explanation. Investigate means the team does not yet know why the benchmark gap exists.
The next action should be narrow. If activation is weak, run five onboarding interviews, fix one confusing step, and measure the next cohort. If CAC payback is worsening, review the lowest-converting funnel stage and listen to lost-deal calls. If net revenue retention is below target, analyze expansion requests and renewal objections by segment. A benchmark review should create one or two operating commitments, not a wish list.
This is also where a public feedback loop helps. If prospects keep asking for the same integration, the request might explain demo friction. If retained customers repeatedly vote for workflow improvements, those improvements may protect renewal better than a flashy new module. For small teams, FeaturAsk keeps that signal organized with a 1 month free trial, no credit card required, and pricing at $29.95/year.
Useful external benchmark sources
No single report should define your plan, but a few public sources are useful calibration points. SaaS Capital's research is helpful for private-company growth, retention, and operating benchmarks. OpenView's SaaS benchmarks are especially useful for product-led growth, pricing, acquisition, and company-stage comparisons. ChartMogul's SaaS Benchmarks provides retention and revenue benchmarks from subscription data. The KeyBanc SaaS Survey is another long-running reference for private SaaS performance.
Use these sources to build a range, not a single target. Then compare the range with your own cohorts, customer interviews, and funnel behavior. A benchmark from a respected report is still only a starting point if your customer segment, price point, or sales motion is different.
Turning benchmark gaps into product decisions
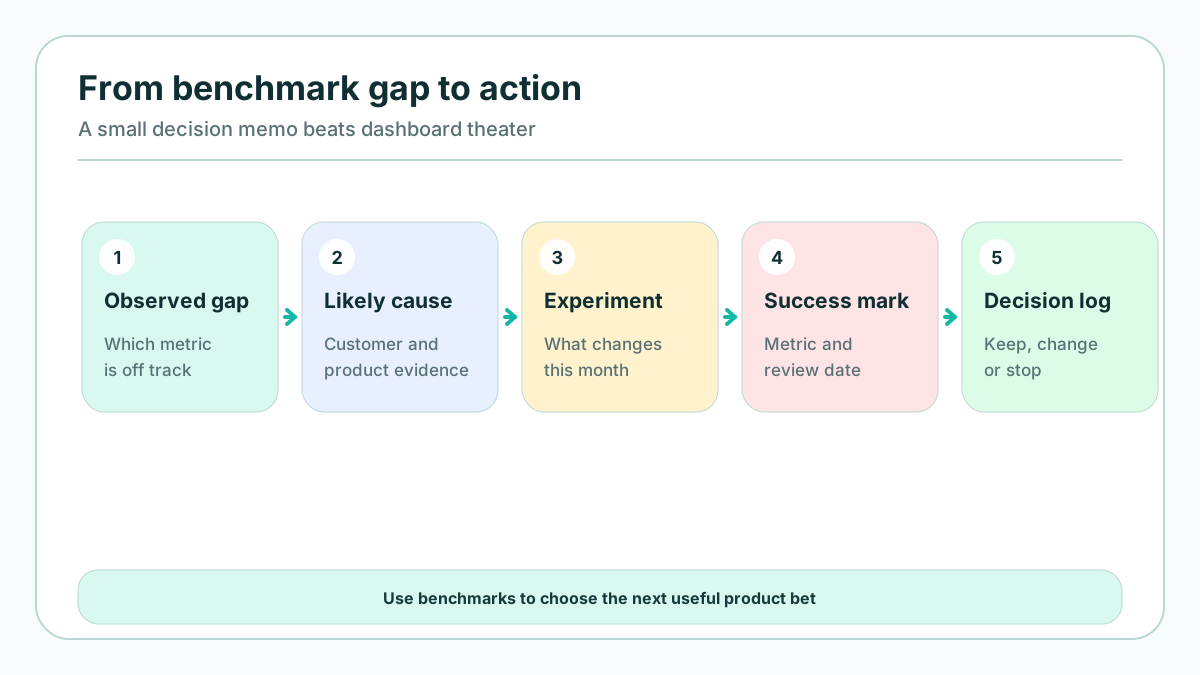
The best benchmark process ends in a decision customers can feel. If activation is below benchmark, improve the first-run experience. If retention is weak, fix the workflow or expectation gap that causes customers to leave. If CAC payback is too long, improve positioning, qualification, onboarding, or packaging before spending more money. If expansion is below peer levels, study which successful accounts have additional unmet needs.
A practical workflow is to pair every benchmark gap with three evidence sources: quantitative segment data, customer language, and a small experiment. For example, if trial-to-paid conversion is weak among teams with more than ten users, look at setup completion data, read feedback from those accounts, and test a guided team-invite flow. The experiment should be small enough to learn within one review cycle.
Internal communication matters too. When you explain benchmark gaps to a team, avoid generic statements like “we need better growth.” Say, “Our self-serve activation rate is below target because new accounts are not inviting teammates; this month we will test a collaborative setup checklist.” That clarity turns a benchmark into work.
Teams planning roadmap communication can connect this process with public roadmap benefits and SaaS buyer journey mapping. Roadmaps explain what is changing, while buyer-journey work clarifies when prospects need proof, education, or reassurance.
Conclusion
SaaS growth benchmarks are most valuable when they improve judgment. They help you notice whether growth is healthy, whether acquisition is efficient, whether customers are staying, and whether product adoption supports the revenue story. They become dangerous only when teams copy averages without understanding context.
Use benchmarks to ask better questions: Which peer group is fair? Which segment explains the variance? Which customer behavior would prove the diagnosis? Which action can we test in one month? When the answer combines financial data with real customer language, growth planning becomes calmer and more useful.
If your next benchmark review needs a clearer customer signal, try FeaturAsk for a free month with no credit card; it stays simple for small SaaS teams at $29.95/year.