60 Essential Product Marketing KPIs to Track
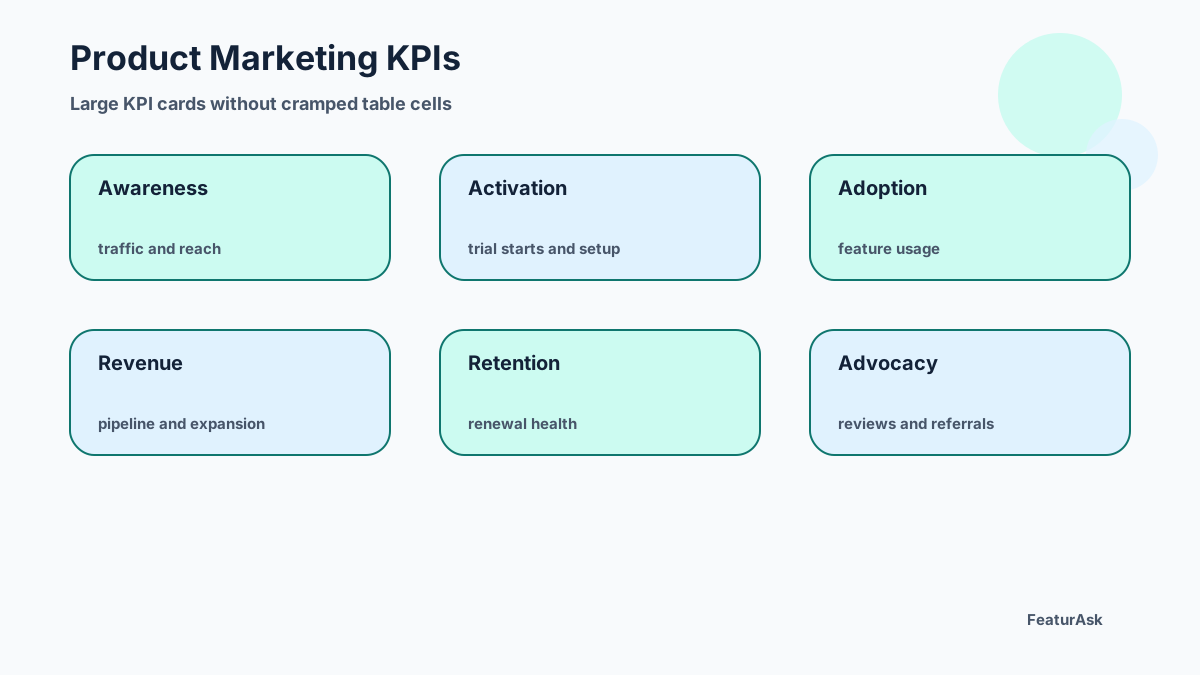
Product marketing KPIs (Key Performance Indicators) are useful only when they improve decisions. (A Key Performance Indicator is a quantifiable measure of performance over time for a specific objective.) A giant dashboard can look sophisticated while hiding the real question: are the right customers understanding, trying, adopting, and advocating for the product? The best product marketers connect market signals to product outcomes.
This guide covers 60 essential KPIs, grouped by the decisions they support. You do not need all 60 at once. A launch team may focus on awareness, activation, and feedback. A mature SaaS company may care more about expansion, retention, and competitive win rates. A startup may need proof that positioning drives qualified trials.
If your KPI system lacks customer context, add a feedback loop beside the metrics. FeaturAsk gives teams a place to collect requests, votes, and roadmap comments. You can try it for one month free with no credit card and keep it at $29.95/year if it becomes part of your operating rhythm.
How to choose product marketing KPIs (Key Performance Indicators)
Start with the decision. Will the metric change positioning, campaign spend, onboarding, sales enablement, roadmap priority, pricing, or retention work? If not, it may be a vanity metric. Next, define the segment. Product marketing metrics become more useful when split by persona, company size, channel, use case, geography, or lifecycle stage.
Finally, combine quantitative and qualitative data. A landing page conversion rate tells you what happened. Customer comments, sales objections, and open-ended survey responses explain why.
Awareness and visibility KPIs
-
Brand awareness: aided or unaided recognition among your target audience. 2. Share of voice: how often your brand appears versus competitors in relevant conversations. 3. Organic search impressions: visibility for important category and problem terms. 4. Search ranking for non-branded keywords: whether buyers can find you before they know your name. 5. Website sessions from target geographies or industries. 6. Content reach across owned and earned channels.
-
Press mentions: coverage quality, not just count. 8. Analyst or marketplace visibility: presence in the places your buyers research. 9. Social engagement rate: meaningful reactions and comments divided by reach. 10. Community mentions: organic discussion in forums, Slack groups, Reddit, or LinkedIn. 11. Branded search growth: a signal that awareness is turning into active curiosity. 12. Direct traffic quality: direct visitors who match target segments and continue to high-intent pages.
Lead generation and conversion KPIs
-
Marketing qualified leads: contacts meeting your fit and engagement criteria. 14. Sales qualified leads: leads accepted by sales as worth pursuing. 15. Lead-to-MQL conversion rate. 16. MQL-to-SQL conversion rate. 17. Demo requests. 18. Trial signups. 19. Free-to-paid conversion rate.
-
Landing page conversion rate. 21. Cost per lead. 22. Cost per acquisition. 23. Click-through rate for campaigns. 24. Form completion rate. 25. Channel conversion by segment. 26. Pipeline sourced by product marketing campaigns. 27. Pipeline influenced by product marketing assets.
The key is quality. More leads are not helpful if they do not fit the product. Product marketing should work with sales and product to define what “qualified” means in practice.
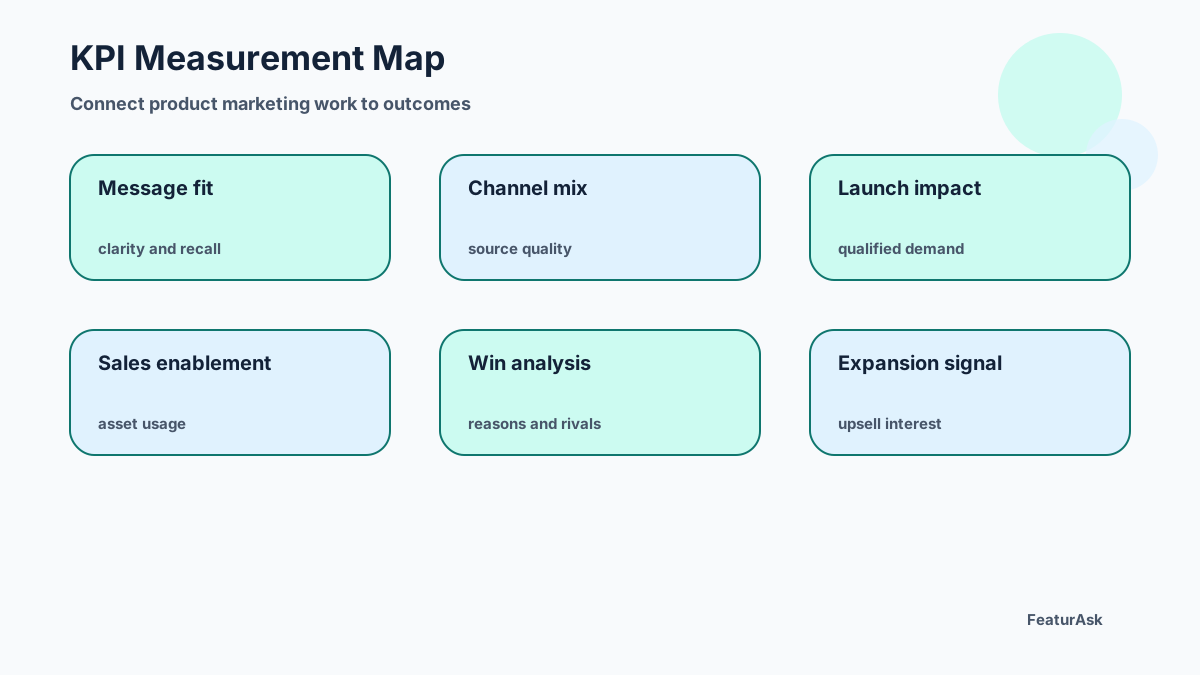
Sales enablement KPIs
-
Win rate by segment. 29. Competitive win rate. 30. Sales cycle length. 31. Average deal size. 32. Proposal-to-close ratio. 33. Content usage by sales teams. 34. Battlecard usage. 35. Objection resolution rate.
-
Demo-to-opportunity conversion. 37. Opportunity-to-customer conversion. 38. Pipeline velocity. 39. Sales confidence score after enablement. 40. Message consistency in recorded calls.
These KPIs show whether product marketing is helping revenue teams explain value. If salespeople ignore enablement content, either the content is hard to use or it does not match real buyer conversations.
Acquisition and onboarding KPIs
- Customer acquisition cost. 42. Time to first value. 43. Onboarding completion rate. 44. Activation rate. 45. Setup task completion. 46. Invite or collaboration rate. 47. Feature discovery rate. 48. Early churn.
Onboarding KPIs are a bridge between product marketing and product management. The promise made on the website must match the first product experience. If activation is weak, revisit positioning, signup flow, templates, documentation, and in-product guidance.
Product engagement and adoption KPIs
- Daily, weekly, or monthly active users. 50. Product stickiness, often measured as DAU divided by MAU when relevant. 51. Core feature adoption. 52. Frequency of high-value actions. 53. Depth of usage by account. 54. Retention by cohort. 55. Expansion feature adoption.
Adoption metrics should be tied to a value hypothesis. A login is not always meaningful. A high-value action is something that indicates the user received or created value. For FeaturAsk, examples might include submitting feedback, voting, updating roadmap status, or publishing a changelog.
Satisfaction and advocacy KPIs
- Net Promoter Score. 57. Customer Satisfaction Score. 58. Customer Effort Score. 59. Review rating and review quality. 60. Referral rate.
These metrics need context. A low score without comments is hard to act on. Ask follow-up questions and connect feedback themes to roadmap decisions. That is where a feedback platform helps: it turns sentiment into visible requests and trade-offs.
Revenue and retention KPIs to keep nearby
Even though the list above reaches 60, product marketers should often keep a few company-level metrics nearby: monthly recurring revenue, annual recurring revenue, net revenue retention, gross revenue retention, expansion revenue, churn reasons, and customer lifetime value. These are not always owned by product marketing, but they reveal whether messaging, packaging, adoption, and customer fit are working together.
Use them carefully. Product marketing influences revenue, but it rarely controls every input. Treat revenue metrics as shared indicators rather than isolated performance scores.
Launch-specific KPIs
A launch should have a measurement plan before the announcement. Track baseline awareness, launch page traffic, campaign engagement, demo or trial conversion, product usage after launch, feedback volume, support questions, customer sentiment, and adoption among the segment the feature was built for.
Launch metrics should continue after launch week. Some features require a month or a full billing cycle before adoption becomes visible. A strong launch review asks what the market understood, what users did, what support heard, and what product should improve next.
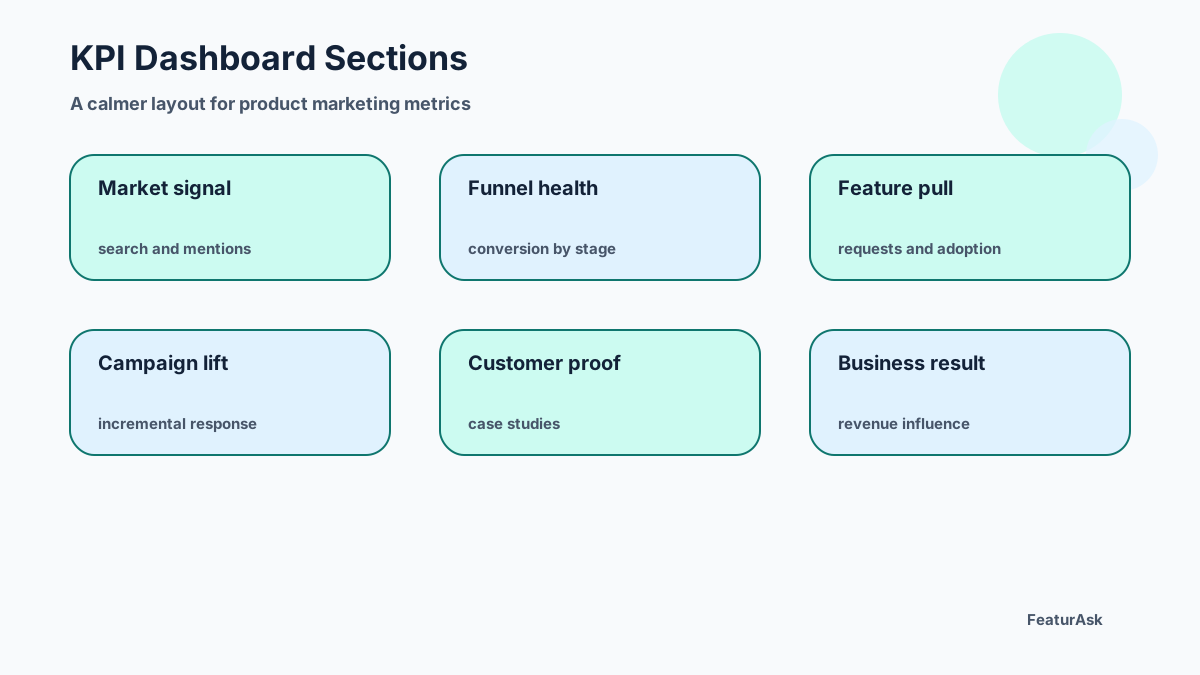
Qualitative KPIs and customer insight
Qualitative signals deserve more respect. Track recurring sales objections, customer interview themes, user testing findings, open-ended survey responses, support tags, churn notes, feature request trends, and roadmap comments. These signals often explain why a numeric KPI moved.
For example, a landing page may convert poorly because pricing is unclear, because the wrong persona is arriving, or because the product lacks a key integration. The conversion rate alone cannot tell you which issue matters. Customer language can.
FeaturAsk can sit beside analytics as the qualitative system of record. If you want to connect feature requests to roadmap updates, start with one month free and no credit card. The plan stays simple at $29.95/year.
KPI review rhythm
Review leading indicators weekly during campaigns and launches. Review adoption, retention, and revenue metrics monthly. Review positioning and market-level metrics quarterly. Every review should end with a decision: continue, stop, change message, change audience, improve onboarding, adjust roadmap, or collect more evidence.
Avoid dashboard sprawl. Retire metrics that no longer drive action. Promote metrics when they become strategically important.
Building a KPI dashboard people actually use
A product marketing dashboard should fit on one screen for each audience. Executives need a small set of business and market indicators. Sales leaders need pipeline, win-rate, competitive, and enablement signals. Product managers need adoption, feedback, activation, and launch learning. Product marketers need the connective tissue across all of them.
Organize dashboards by decision rather than department. For a launch, show target audience reach, message engagement, trial or demo conversion, activation, feedback themes, support questions, and early retention. For a positioning project, show search demand, sales objections, win-loss themes, conversion by segment, and qualitative language from customers. This structure makes it obvious what to discuss next.
Every metric should have an owner, source, cadence, and interpretation note. If nobody owns a metric, it will decay. If the source is unclear, debates will shift from decisions to data trust. If the cadence is wrong, teams will either overreact to noise or notice problems too late.
Diagnosing metric conflicts
Product marketing metrics often disagree. Awareness may rise while conversion falls. Trial signups may increase while activation declines. Win rate may improve in one segment and worsen in another. These conflicts are not dashboard failures; they are clues.
When metrics conflict, segment first. A campaign may attract a broader audience than the product is ready to serve. A new message may work for technical buyers but confuse executives. A launch may drive curiosity but expose onboarding friction. Look for differences by channel, persona, company size, use case, lifecycle stage, and geography.
Then add qualitative evidence. Review sales call notes, support tickets, open-ended survey responses, cancellation reasons, and feature requests. The explanation usually lives in customer language. For example, “too expensive” may actually mean unclear value, missing integration, weak onboarding, or a buyer who was never a good fit.
Setting targets without gaming behavior
Targets help teams focus, but bad targets create bad behavior. If product marketing is measured only on lead volume, it may generate low-fit leads. If launch success is measured only on impressions, the team may optimize for noise instead of adoption. If enablement is measured only on content created, nobody asks whether sales uses it.
Set targets around quality and movement. Pair lead volume with conversion quality. Pair awareness with branded search or direct traffic quality. Pair launch reach with activation. Pair adoption with feedback sentiment. Pair win rate with deal fit. Balanced targets make it harder to win the metric while losing the customer.
Finally, revisit targets when strategy changes. A company moving upmarket should not judge product marketing with the same dashboard it used for self-serve acquisition. Metrics should follow the business model.
Product marketing KPI examples by company stage
An early-stage company should track message clarity, qualified traffic, trial or demo conversion, activation, customer interviews, and the objections that block purchase. At this stage, learning speed matters more than perfect attribution. The team is still proving who cares and why.
A growth-stage company should add channel efficiency, segment conversion, sales enablement usage, competitive win rate, onboarding completion, feature adoption, and retention by cohort. The question becomes whether go-to-market motion and product experience scale together.
A mature company should track market share indicators, expansion revenue, net revenue retention, win-loss by segment, regional awareness, analyst or marketplace presence, and portfolio adoption. The challenge shifts from proving demand to defending differentiation and finding the next source of growth.
Connecting KPIs to roadmap feedback
Product marketing often sees market symptoms before product teams see product causes. A campaign may perform well until prospects ask for a missing integration. Sales may lose deals because a competitor has a workflow your roadmap has not prioritized. Customers may adopt a feature but request improvements that would make it easier to expand.
Do not leave those insights in campaign reports. Convert them into feedback themes, attach examples, and review them with product management. When product marketing and product management share the same evidence base, roadmap decisions become easier to explain and launches become easier to measure.
Useful references
Helpful external references include Google Analytics documentation, HubSpot marketing statistics, Amplitude product metrics guidance, and Qualtrics guidance on Net Promoter Score. For deeper follow-up, pair this guide with FeaturAsk resources on feedback board software, customer feedback tools, and feature request software.
Product marketing KPIs should clarify the path from market attention to customer value. Choose metrics that change decisions, segment them carefully, and pair every chart with customer context before each launch review. If you need an affordable customer feedback layer for that context, try FeaturAsk free for one month with no credit card and keep it for $29.95/year.